
The W’bal model – can we quantify athletes’ anaerobic “gas” levels?
Introduction: what is anaerobic?
Before we dive into the quantification of anaerobic gas, and see if it is possible, we need to make sure that we are all on the same page when it comes to definitions. So whenever we talk about energy systems, we usually see similar tables and graphs that contain these 4 energy systems:
ATP store
Phosphocreatine
Lactic acid / glycogen
Aerobic / oxidative system
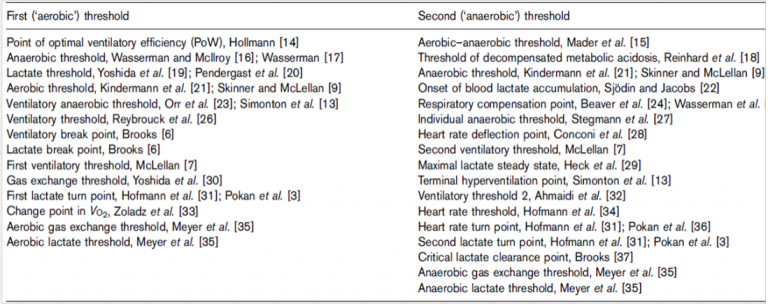
Table 1: The different names used to describe the first and second thresholds. Adopted from Binder et al. (2008)
In this article, we will consider anaerobic fitness as everything that is not the Aerobic/oxidative system. In more scientific terms, we are talking about all the energy that is available in intensities above the second threshold (definitions again: physiologically speaking, there are two thresholds. Their name can vary according to the way you measure them, or according to your textbook or background, but there are always two and they always represent the same thing). Coaches will usually use aerobic threshold and anaerobic threshold or first blood lactate threshold and second lactate threshold. We will refer to the two threshold as the first threshold (same as lactate threshold or gas exchange threshold) and the second threshold (same as Maximal Lactate Steady State or Respiratory Compensation Point).
Last clarification about definitions: as you can see in Table 1, many fitness professionals, coaches, and even researchers, using a different term to describe the same thing. But sometimes, unfortunately, people are mixing them up. So please, make sure you know what you want to measure before you measure it.
Introducing W’:
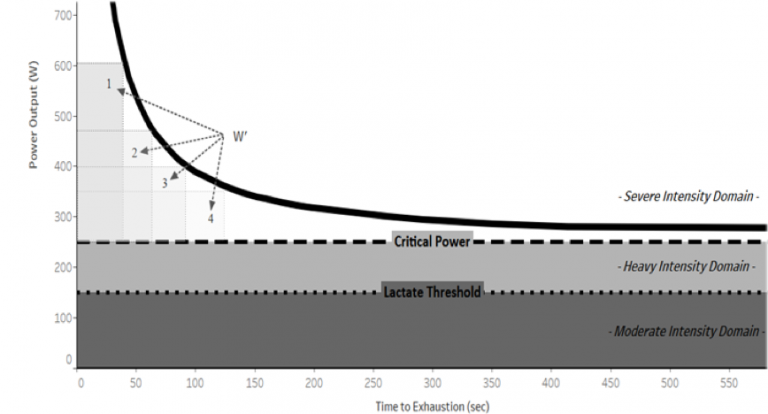
Figure 1: The hyperbolic intensity- duration plot
So, now that we are on the same page, and we want to quantify available energy from systems in intensities that are above the second threshold- how do we do it?
W’ (called double-u prime) is a mathematical model-based constant (measured in kilojoules) with physiological interpretations. Physiologically it represents a fixed amount of work that can be performed in intensities above the second threshold (in other words, above critical power / at the severe intensity domain). Mathematically speaking, W’ is the curvature constant or of the hyperbolic intensity- duration plot. In other words, at the curvilinear part of the graph in Figure 1(1,2,3,4) W’ is the area under the curve for each of these points and they are equal to each other.
Why W’?:
Why should we care about W’ when we have ways to quantify anaerobic work capacity, such as the Wingate test? Here are some of the answers:
W’ can be estimated easily (every time we estimate critical power, we also estimate W’. Critical is an excellent field test to monitor the 2nd threshold)
No need for BL testers
No need for metabolic carts
Free
Can be used during the race/ game
Strategize pacing / substitutions
Enhance performance
Predict performance
Detect doping
Monitor loads
No need in lab or equipment (e.g: Wingate, biopsies)
How to calculate W’?:
There are various ways to measure W’. Some ways can be done on real in-game performance (assuming you have enough data), while others require dedicated testing sessions. Here are 2 examples for the dedicated testing sessions:
I:
Have the athlete perform a series of 4-6 maximal constant-effort trials of varying durations between 2 and 15 min:
Bicycle ergometry: set to a constant work rate and measure the time to exhaustion (when cadence can no longer be maintained).
Running: set different distances and record the best times for each trial
Obtain average power/velocity for each trial (work/distance divided by time).
Use linear regression to estimate the value of critical power
The same as before, only with 1/time as the X-Axis
The slope of this graph is W’.
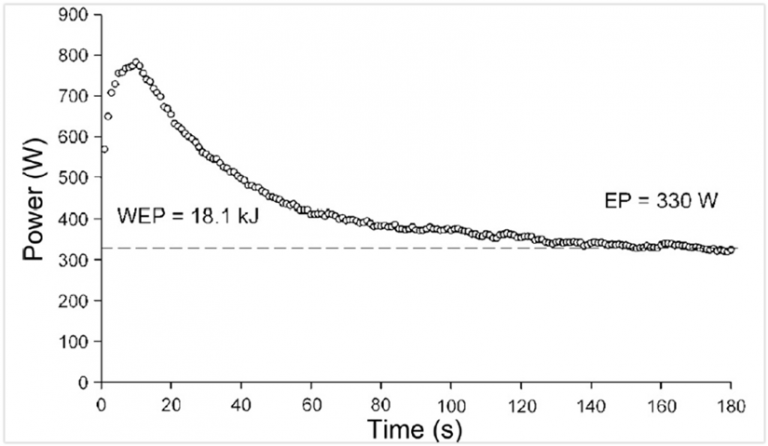
Figure 2: 3 min all out test. Adopted from Vanhatalo (2007)
II:
3 min all out test: Using a Bicycle ergometry, the athlete undergoes one trial as fast as he/she can, with no pacing. This looks like 3min Wingate, so no, it is not an easy test to take!
The mean power from the last 30 sec of the test is the critical power. All the work measured above this value, throughout the 3min test, is the W’ (Figure 2).
What Determines W’?
Various factors affect the level of W’. These factors include environmental ones, training related once, nutrition related ones, and more. Here are some examples:
Depletion of PCr
pH and buffering abilities
Changes in muscle substrates and metabolites (e.g: accumulation of Pi and lactate)
Recruitment of type II muscle fibers
Glycogen stores
Reduction of muscle efficiency
The development of the VO2 slow component
Training
Supplements
Altitude
Doping
*Note that all of the above will also affect any other kind of anaerobic work capacity test, and are not unique to W’.
W’ Balance:
W’balance (W’bal) is a variable that represents W’ at any given time. Wʹbal model stipulates that the remaining amount of Wʹ, or “balance” of Wʹ (Wʹbal), is the total Wʹ (Wʹo) subtracted by the product of Wʹ expended in a prior bout of severe-intensity exercise (Wʹexp) and a decreasing exponential function of time, with time constant ?. Meaning, that while exercising in various intensities, if intensity is below the second threshold (critical power) – W’bal gets replenished, and if the intensity is higher than the second threshold- W’bal it decreases.

Figure 3: W’bal levels while exercising in different intensities. Adopted from Clarke & Skiba (2013)
Figure 3 is an illustration of how W’bal looks like while exercising in different intensities. The left axis and the light gray graph represent power (or intensity), the right axis and the dark gray graph represent W’bal at any given time, and the X axis represents time.
From Power to Velocity:
So far we talked about power in order to quantify intensity. But, in sports in which we cannot measure power, but we can easily measure velocity or displacement, the same model can still be used. This time, instead of critical power, we are talking about critical velocity; and instead of W’ we are talking about D’. The definition of D’ is the maximum distance an individual can cover in intensities (velocities) that are about critical velocity. What all of this means is that we do not need a power meter in order to implement this model; a GPS tracker or any other tool that can measure displacement would do!
Team sport athletes, such as soccer, football, and rugby players, who are usually wearing GPS trackers to quantify other aspects of fitness, are a perfect match for this model. If we take their GPS data and we plot, for each individual athlete, their maximal average velocity against time (or in other words, we take the maximal distance each athlete covered for time X, X+1, X+2,…X+N, and we calculate what was the average velocity for each time period), we would get a graph that looks exactly like the graph on figure 1; only that X axis would be time, and Y axis would be average velocity. Using this graph we can easily find each athlete’s critical velocity (the asymptote of the graph), and their D’ (the area under the curve in the curvilinear part of the graph). Doing this simple trick of plotting GPS data VS time, replaced the need for power meters, and provides us with the same valuable information for each athlete: their critical velocity (the second threshold), and their D’ (their anaerobic capacity).
Similarly to figure 3, that demonstrates the application of the W’bal in individual sport, we can now apply a similar model to team sports athletes. If we know their critical velocity, and their velocity at any given time, we can calculate their anaerobic gas (D’) at any given time, taking rest/activity period into consideration!
In addition, the implementation of the critical velocity model in team-sports would also eliminate the need for dedicated testing sessions to assess aerobic/anaerobic fitness, and coaches would be able to optimize practice planning, monitoring of fatigue, and inform tactical planning. In addition to its physiological interpretations, and in contrast to lab-based/invasive tests, the critical velocity model can be used constantly throughout a session/ game, providing continuous data from the field, at any given time and during any type of activity. Therefore, successful implementation of this model should have a big potential to be adopted by sports teams, as it is a cost-effective alternative to other methods, which also provides additional data on a daily basis.